This week Year 7 received their starting profile reports, which assess students as they start the school. These reports are the first we have issued at Churchill since national curriculum levels were removed from both primary and secondary schools. In their absence, we are using several measures to assess students at the Academy, and to track their progress. Our aim was to design an assessment system that gave useful information to students and families, whilst being clear and easy to understand.
Assessment on entry
Key Stage 2 Test Results (SATs)
We get the results for every child who has taken the SATs at the end of Year 6 in their primary school. The overall scaled score – combined from their English and Maths tests – ranges between 80 and 120, with 100 being the national average. At Churchill, the average score we have in our Year 7 is 104.
In addition to the Key Stage 2 results, we do several tests to assess students when they start at the Academy. This helps us to “triangulate” the data and gives us a level playing field for all starters.
CATs Tests
These tests include assessments of students’ performance across four “batteries” of tests:
- Verbal (handling words and language)
- Quantitative (handling number)
- Non-verbal (problem solving)
- Spatial (handling shape in two and three dimensions)
The national average across the four batteries is 100, with scores usually ranging between 90 and 110. At Churchill our average for Year 7 is 103.
NGRT Reading Test
This test assesses reading and comprehension of text. Again, the national average is 100, with scores usually ranging between 90 and 110. At Churchill the average for our Year 7 is 107.
Starting profiles
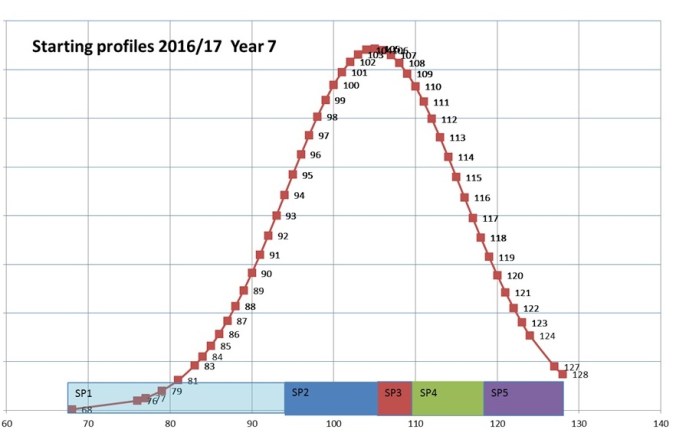
Starting profiles for our current Year 7
Tracking progress over time
When students are assessed in future, we will be able to track their progress relative to their starting profile. In each subject, assessments will be scored and we will be able to report to families whether students have made:
- Expected progress relative to their starting profile
- Good or Exceptional progress (better than expected) relative to their starting profile
- Less than expected progress relative to their starting profile
In other words, if a student with a Starting Profile of 3 completes an assessment and the score shows that they remain in that bracket, they will be assessed as having made “expected progress.” If they have worked really hard and moved up in their assessments, they will be assessed as having made “better than expected progress” and so on.
In the future
At the moment, we are running this assessment system with Year 7, and tracking the progress of Year 8. Over time, as the new GCSEs are taken, we will be able to make more accurate estimates of GCSE grade expectations for students with particular starting profiles. This means we will be able to roll the system out over time across the whole school.
We hope that you find the assessment information useful!
